
Evidence, not promises
Published runs and method studies — numbers unedited.
Two kinds of evidence, both unedited: method studies that ask one question across many instances — 12,397 certified runs, a noise ladder that ends on a real IBM processor, a 996-arm map of where quantum kernel classifiers (QSVM) beat ten classical baselines, and its companion mapping when the trainable quantum model (VQC) earns its keep — and published sample runs, one certified instance each, the same PDFs you can download in the Resource Room. The flattering numbers and the boring ones, including the run where our own product recommended staying classical. Same tools, your data: a certified run on your own workbook takes a day.
What this page shows
Study
Which quantum method to use — tested, not guessed.
Study
What a real quantum processor does to a trained circuit.
Study
Where quantum kernels (QSVM) can win at all — and where they cannot.
Study
The trainable quantum model has its own territory — above a measurable size.
Study
The trainable quantum model can be trained in most of its settings — if you measure locally — and a one-minute screen tells you which.
Study
Quantum-kernel settings are measurable in a predictable corner at every size — and the product’s diagnostic now points to it.
Run
The quadratic speed-up of quantum Monte Carlo, measured — it is there.
Run
Quantum matching a certified optimum on a real treasury case.
Run
And the case where our own tool said: stay classical.
Method studies — many instances, one question
How these studies are made
Every study below comes out of the same machinery — the RQP Evidence Engine. Each design is locked in writing before the first run (from the VQC study onward, publicly tagged before the first run; the kernel configuration atlas study also deposited its design with an independent registry, and from the variational atlas onward the public tag is the series’ registration grade). The RQP suite’s certified classical referees score every run, pipelines are deterministic, and each published number is reproduced from the committed raw results by a committed script before it is printed. Where a published figure was later found imprecise, the correction is disclosed in the document’s revision notes. The methodology of each study is public in its PDF — and the machinery itself is described in the methodology paper (PDF, 8 pages). The 3-minute versions of the studies live in the briefs catalog.
Concentration study · 24 instances · 12,397 certified runs · August 2026
Which quantum method? It depends on what you know going in.
With a certified referee every reasonable QAOA method eventually finds the optimum, so a 0% gap alone does not rank methods. We measured what does: how much probability the trained circuit puts on the proven optimum — across training objective (expected energy vs CVaR), ansatz (fixed depth vs adaptive), start state (uniform vs classical seed) and instance, every run scored against exhaustive enumeration.
−0.91
Penalty ratio vs concentration
100% / 0 of 96
Classical seed start, right vs wrong seed
83 / 75 / 50%
Adaptive ansatz escapes a wrong seed
0.008%
The tallest grain at 16 qubits
Read the full studyShow less▸
The answer is a decision tree — and every branch is a setting
You trust the classical seed
Classical seed start. Optimum on top 100% of runs, ~10% mass at ε 0.25; ε 0.10 roughly triples it. Read it against the certified gap — a wrong seed comes back just as confident.
qaoa_warm_start_mode classical · qaoa_warm_start_epsilon 0.25
You doubt the seed
Adaptive ansatz, deep and well-fed. It escapes what the seeded circuit cannot — given depth and budget; starved of either it fails. Never wins on cost; wins on not inheriting the seed.
qaoa_ansatz adaptive · qaoa_adapt_max_layers 12 · 200–300 iterations per layer · CVaR objective
You know nothing
Soften the penalty first, then CVaR at depth 4–6 from a uniform start. Below ~10 qubits it concentrates on its own; at 14–16 it does not, at these budgets — read the mass and shots-to-99%, not the “most likely = optimum” flag.
lambda_budget (softest that holds) · qaoa_cvar_mode objective · qaoa_p 4–6
All four switches — objective, ansatz, classical seed start, penalty weights — ship in Portfolio Optimization, Credit Allocation and Collateral Allocation RQPs, and every report prints the concentration (probability on the optimum, ×-uniform, top-10 mass, shots-to-99%) next to the certified gap.
- ✓
Two null results, printed. Swapping the matched warm-start mixer for a plain X mixer changed almost nothing — the lock lives in the starting state, not the mixer. And at matched evaluation budgets the adaptive ansatz never wins on efficiency: its screening costs ~290 evaluations per layer.
- ✓
The seed was wrong on every real book. The product's own heuristic missed the certified optimum on all four demo books (2–3 assets off, 0.65–1.60% gap) and 8,000 classical starts did not fix the 16-qubit one. That is what the referee is for.
- ✓
Scope stated. Exact statevector simulation, 20 synthetic dense Markowitz instances at 12 qubits plus 4 real demo books at 7–16 qubits, matched evaluation budgets, 3 optimizer seeds per cell, pre-registered design with amendments recorded. No hardware: shot noise would make the adaptive method's screening worse, not better.
Run recordQL-ST-001Printed verdict: Method study15–16 Aug 2026▸
Product
QAOA Concentration Study (method study)
Question
Which QAOA method concentrates probability on the certified optimum — and under what prior knowledge?
Design
Training objective (expected energy vs CVaR) × ansatz (fixed depth vs adaptive) × start state (uniform vs classical seed) × instance · matched evaluation budgets · 3 optimizer seeds per cell · pre-registered with amendments recorded
Instances
24 instances: 20 synthetic dense Markowitz at 12 qubits + 4 real demo books at 7–16 qubits · 12,397 certified runs
Classical referee
Exhaustive enumeration — every run scored against the proven optimum
Key results
Penalty ratio vs concentration: Spearman −0.91 (CVaR; 95% CI −0.95 to −0.80) · classical seed: right seed 100% of runs, wrong seed 0 of 96 (below 3.1% at 95% confidence) · adaptive ansatz escapes a wrong seed 83/75/50% (1/2/3 assets off, real books, n = 12 per distance — Wilson intervals printed in the study)
Null results (printed)
Matched warm-start mixer vs plain X mixer: almost no change — the lock lives in the starting state · adaptive ansatz never wins on efficiency at matched budgets (~290 evaluations per layer)
Scope
Exact statevector simulation only — no hardware: shot noise would make the adaptive method's screening worse, not better
Reproducibility
Study PDF (18 pages, canonical, Rev. 1.2 — uncertainty intervals on every headline statistic) linked on this page · headline numbers reproduced from committed raw results by a committed script · raw results and design on request
Fixed field order · controlled verdict vocabulary (Advantage demonstrated / Parity / No advantage demonstrated / Inconclusive) · all records machine-readable at /evidence-runs.json
Noise-ladder study · 5 circuits · 3 noise levels + calibrated simulation + ibm_kingston · August 2026
Noise erases depth on today’s hardware — and a calibrated simulation predicts the device only as an optimistic ceiling (×3).
Five trained circuits on a real 14-qubit portfolio book — depth 1, 3, 5, 7 and the adaptive circuit that builds its own 12 layers — replayed unchanged under three synthetic noise levels, under a simulation built from ibm_kingston’s calibration data, and on ibm_kingston itself (IBM Heron r2, 20,000 shots per circuit). Every probability measured against the certified optimum; design locked before the first run, amendments disclosed.
×2.5
Routing overhead on the device
10.1% → 0 hits
Adaptive circuit, simulator vs device
×2.6–3.5
Calibrated prediction vs device
44 s
Processor time for all five device runs
Read the full studyShow less▸
What it means for practice
Noise-free depth on a seed-locked circuit is cheap and worthless under noise: nothing past three layers survives realistic error rates. The adaptive circuit’s escape from a wrong seed is real and worth paying for only on hardware at about 99.9% two-qubit fidelity after routing — not yet available for a 14-qubit all-to-all problem on today’s Heron processors. The products now print the noise ladder next to the certified gap, flag retention above one as a seed-lock warning, and label a calibrated prediction as an optimistic bound.
Why the prediction misses: routing explains why the device is so much harsher than textbook noise levels — every logical two-qubit gate became about 2.5 on the heavy-hex lattice, and the calibrated simulation already runs that routed circuit. What it still leaves out — mainly decoherence while qubits wait idle in a 450-to-4,400-layer circuit, crosstalk between simultaneous gates and coherent errors that compound rather than average — is what makes even the routed prediction about three times too rosy. Reported per-gate error rates are measured on isolated gates; a dense portfolio circuit is not that.
- ✓
Retention above one is a warning, not a result. At moderate noise the optimum's probability rose (retention 1.0–1.5) on the seed-locked circuits — the wrong seed's peak spills onto its neighbours. The clean indicator, top-10 mass, fell monotonically on every circuit and noise level. The products now flag this signature.
- ✓
Only p = 1 retained anything on the device. Seed peak 8.5% → 0.8%, top-10 mass 21% → 3.7%, 8,170 distinct bitstrings in 20,000 shots. From p = 3 on the readout is statistically uniform (top-10 mass 0.36% against a 0.33% sampling floor). One book, one day, one backend, raw and unmitigated — the study says so.
- ✓
Measuring the device was the easy part. Five circuits, 100,000 shots, 44 seconds of processor time, queue waits under ten seconds. Predicting the device is the harder part: the full physical noise model is far too expensive to sample shot by shot, so the calibrated prediction uses the reported gate and readout errors only — one reason it is optimistic — and one prediction run was repeated after a transient error on IBM’s side. For a 14-qubit circuit the device answers in under a minute with ten times the shots — and its answer is the ground truth the prediction is trying to approximate.
Run recordQL-ST-002Printed verdict: Method study21–22 Aug 2026▸
Product
QAOA Noise-Ladder Study (method study)
Question
How much of a trained circuit's concentration survives noise as depth grows — and does a calibrated simulation predict the real device?
Design
5 trained circuits (standard p = 1, 3, 5, 7 + adaptive cap 12; CVaR, classical seed start) replayed unchanged at 3 parametric noise levels (2-qubit fidelity 99.9 / 99.5 / 99.0%), a calibrated simulation of ibm_kingston and ibm_kingston itself · pre-registered, 6 amendments recorded · 100-hit statistical floor
Instance
Real 14-qubit demo book (16,384 states); classical seed wrong by 3 assets (certified gap 1.60%)
Classical referee
SCIP branch-and-bound, certified optimum proven on every run — every probability measured against it
Hardware
ibm_kingston (IBM Heron r2, 156 qubits), 20,000 shots per circuit, raw (no error mitigation), 44 s of processor time in total · routing onto the heavy-hex lattice multiplied two-qubit gates by ~2.5 (182 → 440 … 2,190 → 5,454)
Key results
Exact P(optimum) saturates at p ≈ 5 (0.065% → 0.170%) · seed-locked circuits smear before they erase: retention 1.0–1.5 at moderate noise while top-10 mass falls monotonically · adaptive circuit (10.08% exact, modal) keeps the optimum modal at 99.9% (2.15%) and is depolarised at ≤ 99.5% · device: only p = 1 retains structure (seed peak 8.5% → 0.8%), p ≥ 3 statistically uniform, adaptive 0 hits in 20,000 (below 0.015% at 95% confidence) · calibration-based prediction optimistic ×2.6–3.5 (shot-noise intervals stay above ×2.3)
Null results (printed)
Prediction of geometric decay per layer was wrong in the smear regime · no configuration delivers a usable readout below 99.9% two-qubit fidelity after routing on this book
Cost (printed)
Device runs: 44 s of processor time for 100,000 shots, queue waits 5–10 s · calibrated prediction: 17–26 min of trajectory sampling per circuit on the standard worker (gate + readout errors; thermal relaxation excluded by design) · one prediction run repeated after a transient IBM account error
Reproducibility
Study PDF (16 pages, canonical, Rev. 1.3 — finite-shot intervals on every headline statistic) linked on this page · IBM job ids printed in the study · headline numbers reproduced from committed raw counts by a committed script · raw results, design and scripts on request
Fixed field order · controlled verdict vocabulary (Advantage demonstrated / Parity / No advantage demonstrated / Inconclusive) · all records machine-readable at /evidence-runs.json
QML advantage-island study · 996 referee arms · 4–16 qubits · exact / 4,096 / 512 shots · August 2026
Where quantum kernels can win at all — a measured map between the classical wall and the concentration wall.
On labels deliberately generated by the quantum kernel itself — the best possible case, stated as such — the QSVM beats ten classical variants, order-matched twin and tuned RBF kernel SVM included, in at least 94% of arms at every size up to 12 qubits, at 512 measurement shots as at exact simulation. The win region erodes at 14–16 qubits; mixing classical structure into the labels kills it entirely. Every verdict is a paired confidence interval against the strongest referee, the design was locked in writing before the grids, and the refuted hypotheses are printed.
0 flips / 756 arms
Referee-robust map
≈ 2 sizes
Heuristic wall arrives too early
α* = 0.75
The classical wall, located
83 / 84
Own checklist vetoed winners
Read the full studyShow less▸
What it means for practice
The practical deliverable is not a promise of quantum advantage but a measurable search procedure: the QML RQP’s deep assessment now measures the concentration of a dataset’s own configured kernel — bulk and tail, with a tail-based shots-to-resolve estimate — and places the run on this study’s benchmark map with calibrated win-fraction bands instead of hard yes/no verdicts. Data that lands outside the envelope gets a fast, inexpensive “no” before any training money is spent; the rare candidate that lands inside earns the expensive experiment.
- ✓
A best-case envelope, not a market claim. Every label in the study is generated by the same quantum kernel the classifier uses — deliberately the best possible case. Inside the winning region nothing is implied about real-world data; our own real-data benchmarks to date land in classical territory, and detecting that cheaply before training is the practical point.
- ✓
Our own conjecture failed its ablation. We conjectured that classification rides the tail of large nearest-neighbour kernel entries. The pre-stated ablation refuted the strong form: on exact kernels, bulk-only and tail-only each retain most performance. The tail's advantage is specific to the shot regime at the largest sizes — and the follow-up condition that showed it is disclosed as post-hoc in the study.
- ✓
Pre-specified, not pre-registered. The design was written down and locked before execution, but its first public push postdates the first grid — so the study claims pre-specification, not registration-grade chronology. Future studies in this series will freeze their designs with an independent timestamp before running.
Run recordQL-ST-003Printed verdict: Method study27–28 Aug 2026▸
Product
QML Advantage-Island Study (method study)
Question
Where can a quantum kernel classifier (QSVM) beat a full classical referee at all — between the classical-learnability wall and the kernel-concentration wall?
Design
996 pre-specified referee arms: label structure (prototype density + a mixing dial toward twin-representable classical structure) × register size (4–16 qubits) × kernel estimation (exact / 4,096 / 512 shots) · 6 replicates per cell · design locked in writing before the grids, amendments and deviations disclosed
Labels (disclosed)
Quantum-native by construction — generated by the same fidelity kernel the classifier uses: a best-case benchmark envelope for this feature-map family, not a real-world claim
Classical referee
Ten variants, each threshold-tuned: logistic regression, random forest, gradient boosting, order-matched periodic twin (parity + best-reference), tuned RBF kernel SVM, neural network · paired-bootstrap Quantum Advantage Factor, win only when the whole 95% CI clears 1.0 · selection-aware panel-max bootstrap confirms 98% of wins
Key results
Wins in ≥94% of arms at every size up to 12 qubits — at 512 shots as at exact simulation; erosion at 14–16 qubits · the per-entry 3/√shots heuristic predicts failure ~2 register sizes too early (binomial small-K variance, learner aggregation, bulk/tail redundancy — measured by ablation) · classical wall located: 0 wins on pure low-order labels, wins begin at 75% quantum-native mixing · expanded referee flipped zero verdicts
Null results (printed)
Lower-wall hypothesis refuted (even one prototype beats the twin) · strong tail-mechanism conjecture refuted by its own ablation (exact kernels are redundant across bulk and tail) · own screening checklist vetoed 83 of 84 winning datasets — replaced by calibrated measurements (kernel statistics rank outcomes at AUC up to 0.97)
Scope
Kernel methods only (variational classifier: dedicated follow-up study) · exact or binomially shot-sampled simulation, no hardware runs · one feature-map family (zz-like, 2 repeats)
Reproducibility
Study PDF (14 pages, canonical) linked on this page · every number re-derived from committed raw results by committed scripts · pipeline deterministic — the production demo run reproduces study values to four decimals
Fixed field order · controlled verdict vocabulary (Advantage demonstrated / Parity / No advantage demonstrated / Inconclusive) · all records machine-readable at /evidence-runs.json
QML VQC island study · 65 fair-recipe trainings · 3 label families · 4–16 qubits · August 2026
The trainable quantum model, mapped — whose territory, at which size, and what a fair attempt costs.
The companion to the kernel study answers the questions that map left open: the two quantum methods occupy different measured territories with a monotone, size-gated crossover; the feared trainability wall does not appear in the tested regime; inference shot noise is negligible; and fairness — full depth plus proportionate stopping — costs a quarter of the naïve budget. Same ten-variant referee, the QSVM head-to-head on identical rows in every cell, and a design that provably preceded every run.
0.98 → 1.18
The crossover, 4 → 16 qubits
no wall to 16q
Trainability, measured
ΔF1 − 0.004
512-shot inference, fixed threshold
150 iters suffice
The price of a fair run
Read the full studyShow less▸
What it means for practice
Do not begin by choosing a quantum algorithm. Begin by asking which representation makes the data learnable — the method choice follows. Below the crossover one quantum method suffices; above it the data’s structure chooses, and both the structure and the crossover are measurable before training money is spent. The QML RQP’s assessment now carries the calibration behind that procedure: kernel-side placement from the first study, fair-run instrumentation and provisional variational screening instruments from this one.
- ✓
Best-case envelopes, in both directions. Each native-label family is built to favour its own method — stated as such — and the teacher generator is deliberately unscreened against the classical bar so the territory test is not biased toward the trainable model. No real-world dataset claim follows; the classical mixture stops both quantum methods identically.
- ✓
One of our own bets lost, and it is printed. We registered the anti-folklore position that initial-gradient statistics would fail as screening instruments. Measured: the highest observed AUC in the calibration (0.79, interval above chance at sixteen datasets). The bet is recorded as lost and the instrument qualifies provisionally — alongside three registered predictions that were refuted and are printed in the scorecard.
- ✓
The design provably preceded the runs. The complete design — grids, ceiling, hypotheses, analysis plan — was publicly pushed and tagged (vqc-island-design-v1) before the first training executed: verifiable chronology via immutable repository history, with its exact scope and limits stated in the study’s appendix.
Run recordQL-ST-004Printed verdict: Method study29–30 Aug 2026▸
Product
QML VQC Island Study (method study)
Question
Does the trainable quantum model (VQC) own territory the quantum kernel method does not — when is it reasonable, what does a fair attempt cost, and what can be screened before training?
Design
65 pre-specified fair-recipe training arms (registered ceiling 150; 24 training-hours, disclosed) across three label families (VQC-native teacher, kernel-native, classical mixture) × 4–16 qubits, plus registered knob probes and instrument calibration · design publicly pushed and tagged BEFORE the first run (git tag vqc-island-design-v1)
Labels (disclosed)
Native families are best-case envelopes per method; the teacher generator is deliberately UNSCREENED against the classical bar (unlike the certified sample) to avoid biasing the territory test
Referee & head-to-head
Same ten classical variants as the kernel study, threshold-tuned, whole-95%-CI verdict rule with selection-aware robustness · plus the QSVM run on identical rows in every cell — the paired VQC/QSVM ratio is the territory readout
Key results
Territory is size-gated with a monotone crossover: paired VQC/QSVM 0.98 → 1.18 across 4–16 qubits on VQC-native labels (QSVM perfect at 4 qubits, VQC ahead from 12); kernel-native territory stays the QSVM's · no trainability wall observed through 16 qubits (init gradients flat 0.055–0.092; best native score AT 16 qubits) · 512-shot inference noise negligible (median ΔF1 −0.004 with the exact-trained threshold held fixed) · a fair run = full depth + proportionate stopping — 150 scaled iterations already hold verdicts on matched structure
Null results (printed)
Registered 14–16-qubit degradation prediction refuted on native territory · registered anti-folklore bet lost: initial-gradient variance predicts outcomes (AUC 0.79, interval above chance) instead of failing · head refitting mildly hurts · verdict-flip-by-budget prediction refuted · knobs cannot buy territory (every variant on mismatched structure stays classical-ahead)
Scope
Exact-statevector training (training under shots: registered future work) · one shallow local-cost ansatz family — the regime the barren-plateau fine print permits; no claim beyond it · small-N instrument calibration (16 datasets), intervals printed
Reproducibility
Study PDF (10 pages, canonical) linked on this page · design tag provably precedes every run · raw per-arm results incl. wall-clock and persisted model parameters committed
Fixed field order · controlled verdict vocabulary (Advantage demonstrated / Parity / No advantage demonstrated / Inconclusive) · all records machine-readable at /evidence-runs.json
QML kernel configuration atlas · 1,200 configurations × 6 datasets · 150 refereed · 4–16 qubits · September 2026
Which quantum-kernel settings can be measured at all — a predictable corner at every size, and why measurable is not yet winning.
The island studies mapped where a quantum kernel classifier (QSVM) can win with one feature map. The product has a configuration screen — five encodings, repeats, an encoding-bandwidth knob added for this study, shot budgets — so this study measured every combination with the product’s own concentration diagnostic, verified a pre-registered sample of 150 against the full classical referee, and turned the result into guardrails. The design was tagged and deposited with an independent registry before the first run; two of its own bets lost and are printed.
25% at 16q
Settings measurable at 512 shots
kernel ≡ 1
One offered setting encoded nothing
4 → 0
Apparent wins, then the exact classical twin
17 s vs 63 s
Screen vs refereed verdict, per setting
Read the full studyShow less▸
What it means for practice
Do not run settings that encode nothing or cannot be measured economically. Do not claim quantum value where an exact classical twin exists. Screen before training — screening rejects bad settings; it does not prove good ones. And read both faces of the kernel: can it be measured, and does it still tell rows apart — a resolvable kernel that is nearly the identity memorizes. The QML RQP now rejects the degenerate setting, flags constant kernels, carries the separable-kernel twin in its referee and bounds the bandwidth knob.
- ✓
Two registered bets lost, one test inconclusive — all printed. We bet that encoding bandwidth would explain more of the concentration outcome than the choice of feature map at every size; on the pre-registered grid it did not, because one dead encoding dominates the comparison (the sensitivity excluding it is labelled post-hoc). Shots-to-resolve did not predict the shot-noise verdict flip (only one configuration flipped), and winners did not sit near the shot-budget line.
- ✓
The sampler missed the known winner. The 150 validation arms were drawn by resolvability strata with one replicate per cell; the configuration the first island study showed to win in ≥94% of arms was not among them. This study bounds that map — the winning region is small and its neighbours in configuration space do not share it — it does not re-confirm it.
- ✓
Deposit-first registration, kept. Design, hypotheses, decision rules and the sampler were tagged in the public repository and deposited with Zenodo (DOI 10.5281/zenodo.22498143) before the first atlas cell ran — the commitment printed in the methodology paper, honoured on its first occasion. No deviations from the grid, instrument, referee, sampler or decision rules; four post-hoc analyses labelled as such.
Run recordQL-ST-005Printed verdict: Method study6–7 Sep 2026▸
Product
QML Kernel Configuration Atlas Study (method study)
Question
Which settings of the quantum kernel classifier (QSVM) can be measured at all, which are dead on arrival — and does measurable mean winning?
Design
5 feature maps (angle-X/Y/Z, iqp, zz_like) × 4 repeats × 5 encoding bandwidths × 4 register sizes (4–16 qubits) × 3 label families × 6 replicate datasets = 7,200 kernel-concentration measurements with the product's own diagnostic, plus 150 refereed configurations drawn by a pre-registered stratified sampler · design tagged (kernel-config-atlas-design-v1) AND deposited with Zenodo (DOI 10.5281/zenodo.22498143) before the first run — the series' first deposit-first study
Labels (disclosed)
The island studies' synthetic families, unchanged: best-case envelopes, not real-world data — the atlas maps configurations, not datasets
Referee
Ten classical variants, threshold-tuned, whole-95%-CI win rule, selection-aware panel-max — and, post-hoc, the exact closed-form classical twin of the angle map (identity verified to 1e-15)
Key results
Measurable at 512 shots: 100% / 86% / 33% / 25% of configurations at 4 / 8 / 12 / 16 qubits (36% at 32,768 shots at 16q) · repeats and entangling maps concentrate as predicted (H1 supported, 48/48 groups) · the angle map with rotation Z encodes nothing: kernel identically 1 in all 1,440 cells, read as 'resolvable' by the diagnostic · of 150 refereed configurations 4 met the win rule at exact simulation — all angle maps, 0 once their exact classical twin joins the referee · off-native configurations memorize (train 0.99, test near chance)
Null results (printed)
Registered bet H2 (bandwidth beats structure) refuted on the pre-registered grid (map factor dominates); post-hoc sensitivity excluding the dead map disclosed · H3 inconclusive (one shot-noise flip) · H4 refuted (0/4 winners near the shot-budget line) · H5 refuted for Z (degenerate), exact for X vs Y · the sampler did not land on study 3's known winning configuration
Scope
Exact and shot-sampled simulation, no hardware · one kernel family (fidelity) · 4–16 qubits · threshold tuning collapses weak models to one class (101/150) — verdict directions robust, absolute scores deflated, disclosed
Reproducibility
Study PDF (10 pages, canonical) linked on this page · every number composed from committed tables by a committed script · raw atlas (7,200 rows) and validation results committed · four product changes shipped from the findings (angle-Z rejected, degenerate-kernel flag, separable twin in the referee, bandwidth knob bounded)
Fixed field order · controlled verdict vocabulary (Advantage demonstrated / Parity / No advantage demonstrated / Inconclusive) · all records machine-readable at /evidence-runs.json
QML variational configuration atlas · 7,488 pre-training screens · 80 refereed trainings · 4–16 qubits · September 2026
Which settings of the trainable quantum model can be trained — most of them, if you measure locally.
The companion to the kernel atlas. The trainable model (VQC) has more knobs than any other tool in the product — five ansätze, entanglement patterns, three measurements, depth, initialization, readout heads, data re-uploading — and the theory warns that some of them make the gradient vanish before training starts. This study screened every combination before training with three instruments, trained 80 pre-registered configurations against the full classical referee, and turned the result into a pre-training screen and guardrails. Eight of eleven registered hypotheses fell, our own warm-start bet among them, and they are printed.
86% at 16q
Trainable with a local measurement
0.93 vs 0.86
The default configuration wins at 16 qubits
×½ per qubit
The global parity measurement is dead at scale
AUC 0.88
The pre-training screen predicts verdicts
Read the full studyShow less▸
What it means for practice
Measure locally — the global observable is dead beyond a few qubits and nothing rescues it. Trust the default start — the product’s initialization is the real protection; the warm start is a second attempt, not a guarantee. Screen before training — a concentrated screen is a stop sign, a trainable one a permit to try. And use the freedom: under the product’s initialization the entanglement pattern, depth and readout head are design choices, not risks. The QML RQP now prints the screen in every variational run, limits the global measurement to 11 qubits, honours the entanglement setting for every ansatz and states what the warm start actually buys.
- ✓
Eight of eleven registered hypotheses fell — mostly community advice, not the product. The entanglement pattern does not order the gradients (17 of 72 cells monotone); data re-uploading lowers the output variance at every size; the quadratic readout head shifts the gradient by 22% (a null we expected to hold); measurement locality is supported under the product’s initialization (13 of 14) but not under uniform angles (9 of 14), where local gradients die too.
- ✓
Our warm-start bet lost, and our cutoff was too coarse. We bet the identity-block warm start would rescue at least 90% of the dead configurations; it rescued 29% (2 of 8 rescue trainings improved) — because the product’s default start had already built the protection in, and nothing rescues the global observable. The registered yes/no trainability cutoff predicts refereed outcomes with AUC 0.68; the graded readings it was built from predict with 0.88 and 0.82, so the product prints those.
- ✓
Public design tag, three disclosed deviations. Design, hypotheses, decision rules and the sampler were tagged in the public repository before the first record; from this study on that is the series’ registration grade. Deviations, all in the appendix: the classical twin applies to angle encodings only; the loss-gradient instrument carries a readout-width bias with a normalized sensitivity reading; the simulator backend was made selectable mid-study with numerically identical results.
Run recordQL-ST-006Printed verdict: Method study7–10 Sep 2026▸
Product
QML Variational Configuration Atlas Study (method study)
Question
Which settings of the trainable quantum model (VQC) can be trained at all, which are dead before training starts — and does trainable mean winning?
Design
14 ansatz × entanglement combinations × 3 measurements (local Z, local Z+ZZ, global parity) × 4 depths × 4 register sizes (4–16 qubits) × 3 initializations (uniform, the product's default, identity-block warm start) × 2 readout heads, plus an encoding slice with data re-uploading: 7,488 pre-training measurements of three instruments (loss-gradient norm, first-observable gradient, output variance), plus 80 refereed trainings (12 anchors, 60 stratified draws, 8 warm-start rescues) · design tagged (vqc-config-atlas-design-v1) before the first run — the series' registration grade from this study on
Labels (disclosed)
The island studies' synthetic families, unchanged: best-case envelopes, not real-world data — one training recipe, not tuned per configuration
Referee
Ten classical variants, threshold-tuned, whole-95%-CI win rule, selection-aware panel-max, kernel method head-to-head on identical rows; every score under both the tuned and a plain 0.5 threshold (verdict directions agree in 91% of arms)
Key results
With a local measurement and the product's default initialization 86% of configurations screen as trainable at 16 qubits, and the gradient stays flat with depth · the default configuration beat the classical referee on its native labels at 4, 8 and 16 qubits (0.93 vs 0.86 at 16) and outscored every other trainable configuration there in 14 of 14 comparisons · the global parity measurement halves its gradient per qubit under every initialization; 0 of 22 refereed runs with it won · 9 wins of 80; 0 of 18 concentrated configurations won or reached kernel parity, 11 of 42 trainable ones did · the graded gradient reading predicts refereed outcomes with AUC 0.88, a 25-iteration probe with 0.82
Null results (printed)
Eight of eleven registered hypotheses fell: entanglement pattern does not order the gradients (17/72 monotone) · the warm-start bet lost (29% rescued vs 90% registered; 2 of 8 rescue trainings) · data re-uploading lowers the output variance at every size · the quadratic head shifts the gradient by 22% (null rejected) · measurement locality supported under the product's initialization (13/14) but not under uniform (9/14) · the registered yes/no cutoff predicts poorly (AUC 0.68) — the instrument does, the cutoff was too coarse
Scope
Exact simulation, no shot noise in training, no hardware · pre-training instruments only · 4–16 qubits · three disclosed deviations (classical twin for angle encodings only, readout-width bias of the loss gradient with a normalized sensitivity reading, simulator backend made selectable mid-study with identical numerics)
Reproducibility
Study PDF (10 pages, canonical) linked on this page · every number composed from committed tables by a committed script · raw atlas (7,488 rows) and validation results (80 arms) committed · shipped from the findings: pre-training trainability screen in every VQC run, global parity limited to 11 qubits, entanglement setting wired into every ansatz, measured warm-start advice, memory-lean gradient and automatic simulator selection
Fixed field order · controlled verdict vocabulary (Advantage demonstrated / Parity / No advantage demonstrated / Inconclusive) · all records machine-readable at /evidence-runs.json
Published sample runs — one certified instance each
Quantum Monte Carlo RQP Lab · published sample run
Theory promises quantum Monte Carlo a quadratic speed-up. Measured here: it is there.
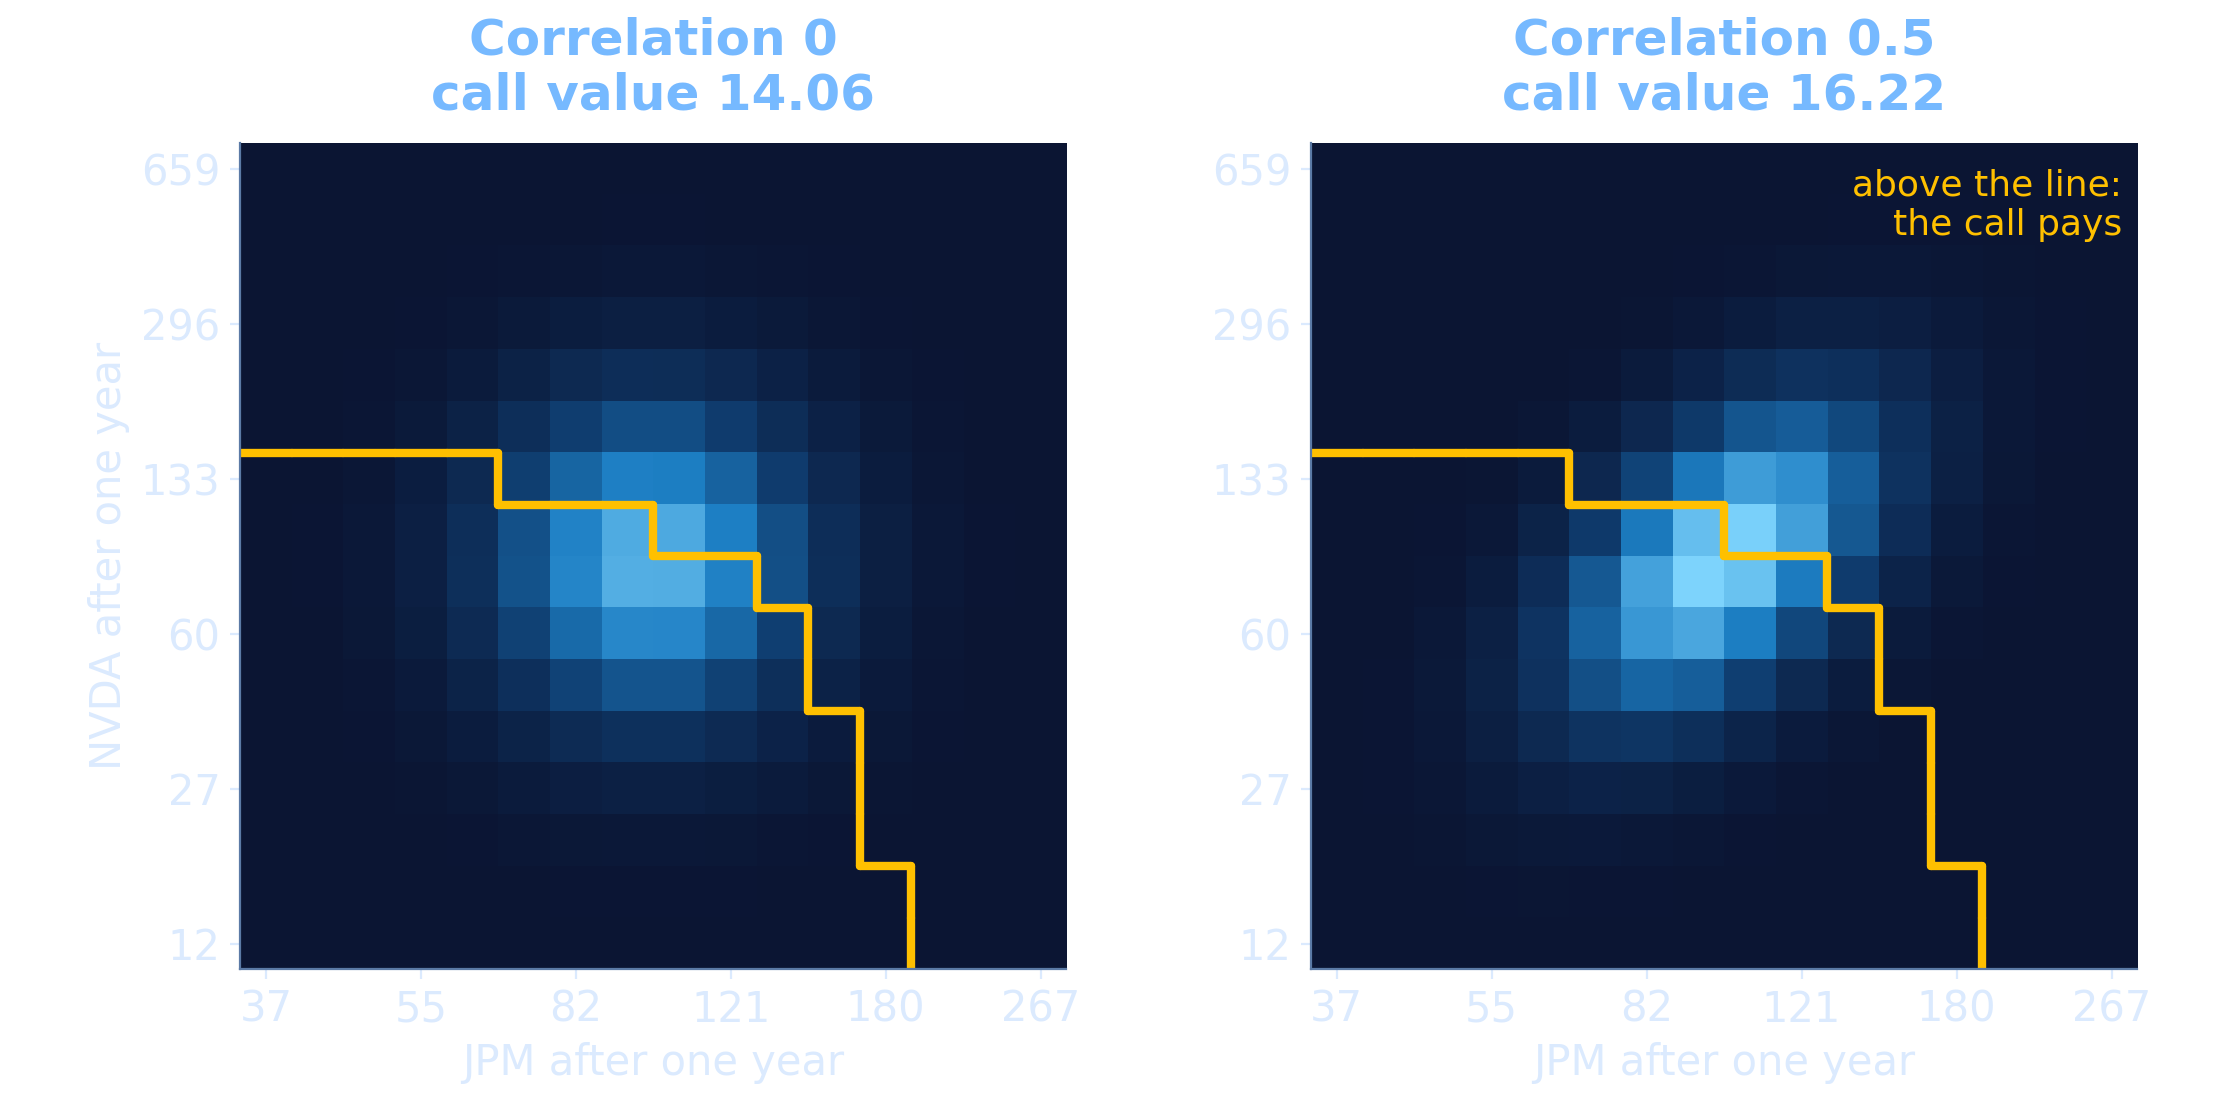
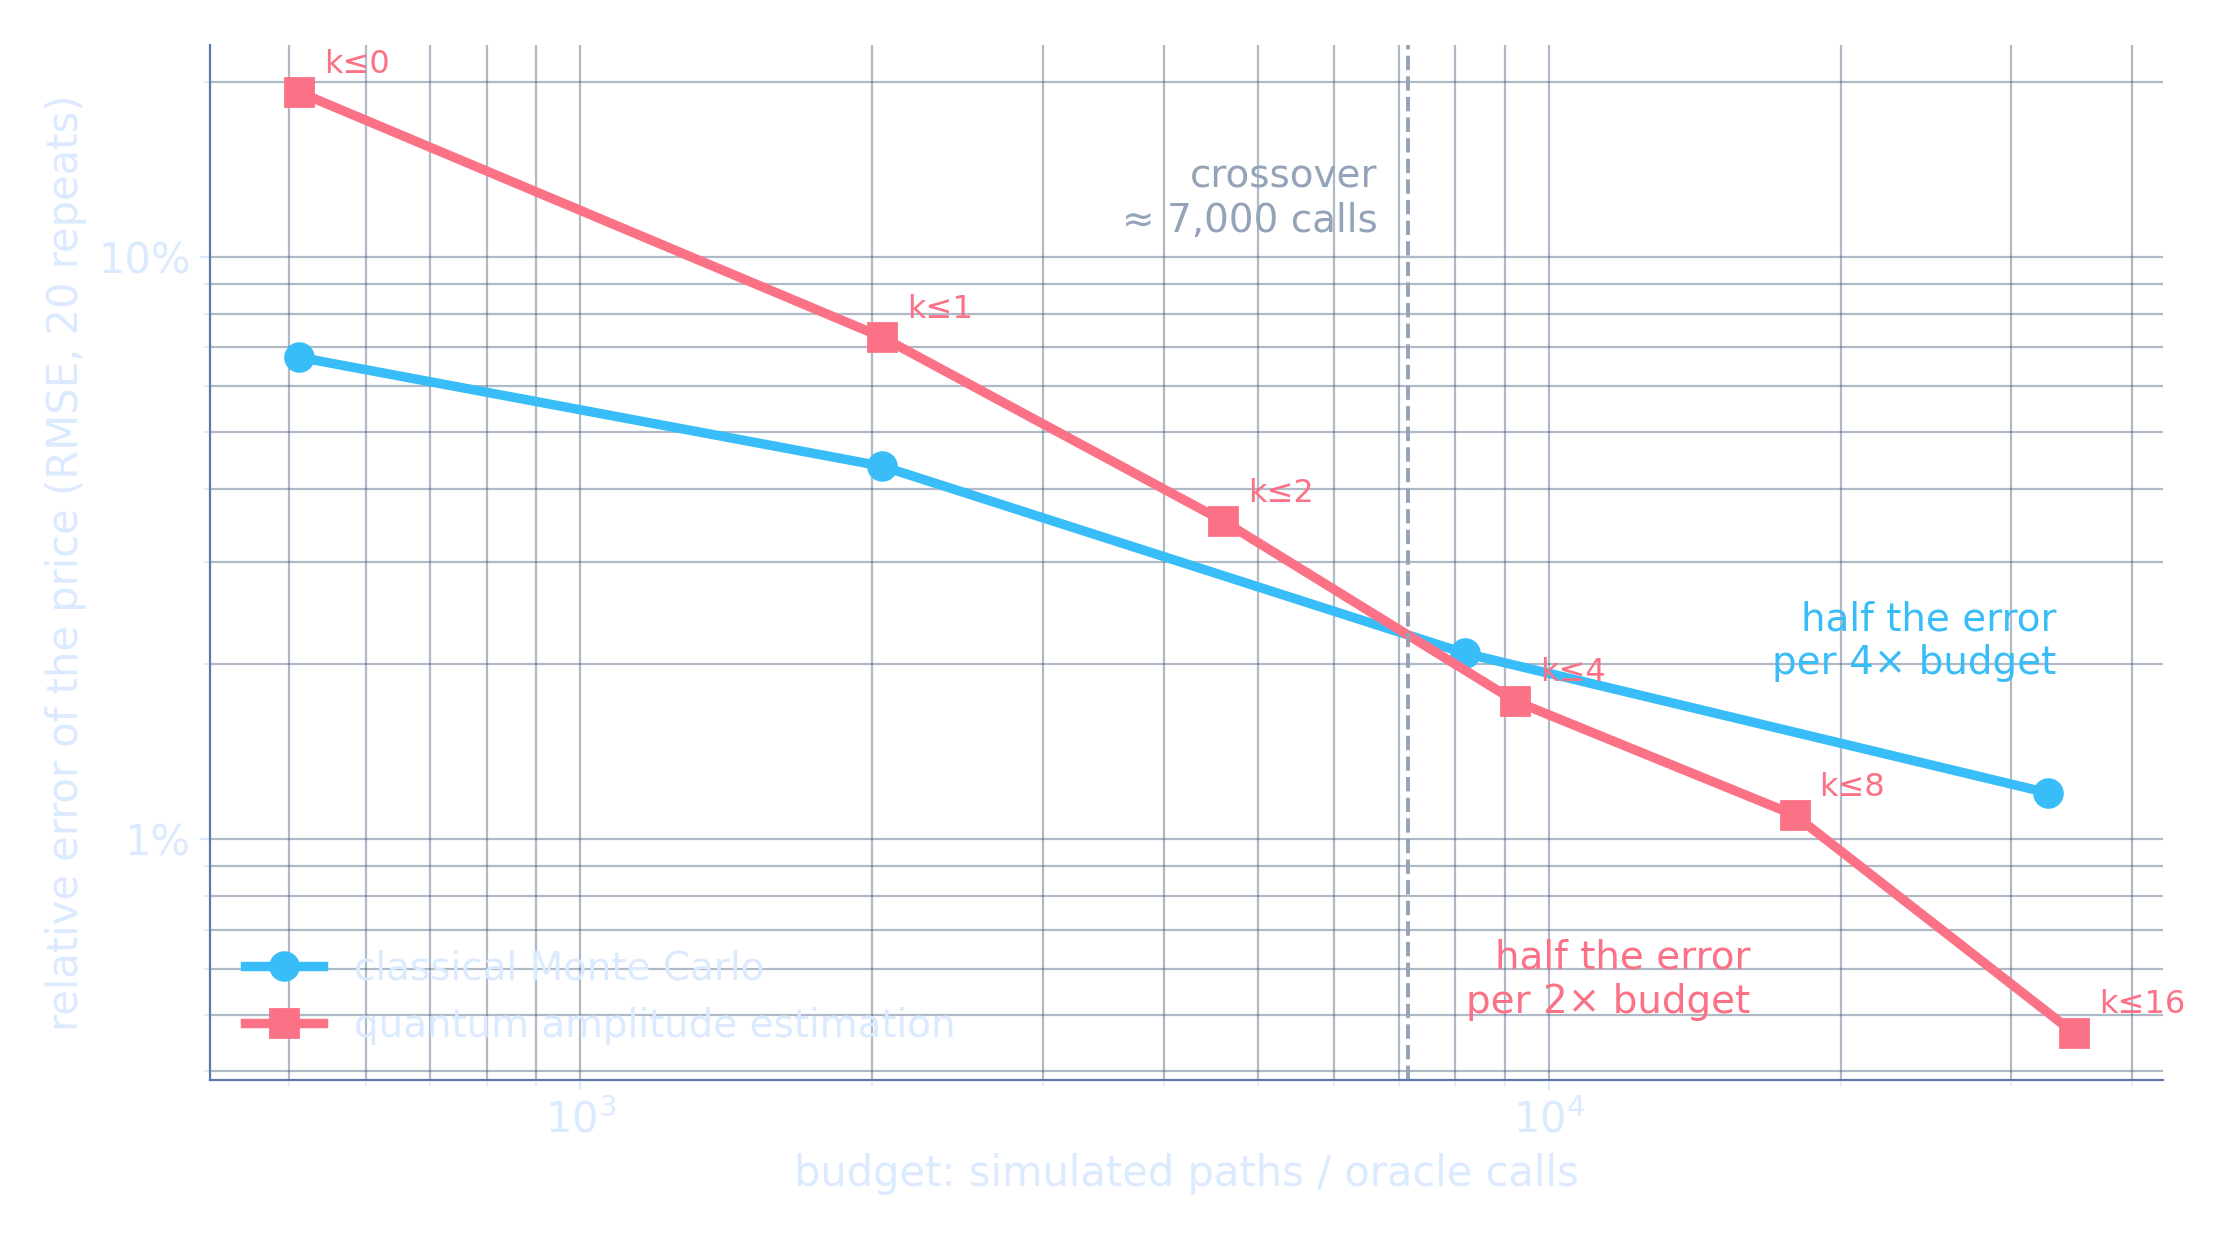
A one-year call on a basket of two correlated shares has no closed formula, so a desk simulates — and classical Monte Carlo needs four times the work to halve its error. Quantum amplitude estimation promises to do it with twice the work. We ran both on the same model at the same cost: 256 joint scenarios on 8 qubits, one payoff qubit, 20 repetitions per budget, the exact value on the grid as the referee. The quantum estimate converges almost twice as steeply, takes the lead after about 7,200 model evaluations and ends 2.6 times more accurate. This is the clearest route to a quantum advantage in finance — and the run also shows what it still needs: circuit depth that only fault-tolerant machines will carry.
0.87 vs 0.43
Convergence: nearly twice as steep
2.6× smaller
Remaining error at the same budget
≈ 7,200
Model evaluations until quantum takes the lead
≈ 6× fewer
Model evaluations for the same accuracy
Read the full runShow less▸
- ✓
The speed-up is measured as a law, not claimed as a win. The run is a statevector simulation that counts model evaluations, and the value can be summed exactly over 256 states — that sum is the referee. What it confirms is the mechanism the theoretical advantage rests on; the printed verdict is Method study.
- ✓
Quantum starts behind, and the report prints it. Below about 7,200 model evaluations plain Monte Carlo has the lower error: a simulated path returns the payoff itself, a quantum shot returns one bit. The classical side here is plain sampling; variance reduction and quasi-Monte Carlo would move the crossover further out.
- ✓
The grid is a modelling choice. 256 scenarios price this call 0.29% below the continuous model; 64 scenarios, 1.0% below. No estimator removes that error, classical or quantum — only qubits do, and with direct loading the circuit grows as fast as the grid.
- ✓
What stands between this and production is depth. The deepest circuit runs 13,056 two-qubit gates in sequence (784 per amplification step). Our noise-ladder study found a 440-gate circuit recognisable on ibm_kingston and a 1,302-gate circuit not. The speed-up is real; the machines that can carry it are fault-tolerant ones.
Run recordQL-EV-006Printed verdict: Method study3 Oct 2026▸
Product
Quantum Monte Carlo RQP Lab (amplitude estimation)
Problem
Pricing a one-year call on a 50/50 basket of two correlated shares — a payoff without a closed formula
Instance
Two lognormal factors (volatilities 28.3% and 57.8%, correlation 0.5), strike 100 · 16 × 16 = 256 joint states on a log-spaced grid · 8 qubits for the distribution + 1 objective qubit
Data
Illustrative market parameters under the labels JPM and NVDA — not a market quote, not investment advice
Classical referee
Exact expectation on the 256-state grid (direct weighted sum) — every error below is a distance to it
Referee result
Grid value 16.2244 · continuous-model value 16.2720 · the grid sits 0.29% below the model
Classical baseline
Plain Monte Carlo on the same grid, 512 to 32,768 paths, 20 seeded repetitions per budget — RMSE 6.7% → 1.20%, fitted slope 0.43 (theory 0.5)
Quantum method
Low-depth amplitude estimation: maximum-likelihood fit over Grover powers 0, 1, 2, 4, 8, 16 at 512 shots per power · direct objective sampling as a control
Execution
Statevector simulator with shot sampling, 9 qubits · 20 seeded repetitions per budget · 2 h 13 min end-to-end
Quantum result
RMSE 19.2% → 0.47% from 512 to 34,816 oracle calls (model evaluations), fitted slope 0.87 (ideal 1) · more accurate than classical Monte Carlo from about 7,200 evaluations on, 2.6× at the largest budget · behind it at smaller budgets
Verdict basis
A convergence-rate comparison on a simulator, counted in oracle calls, on a value that can be summed exactly — a method study by construction; advantage not claimed
Limitations
Deepest circuit 13,056 two-qubit gates (784 per Grover step) — far beyond today's hardware · direct state loading grows as fast as the grid · the classical side is plain Monte Carlo, without variance reduction · terminal distribution only
Reproducibility
Fixed seeds · workbook and certified PDF report in the RQP Resource Room · the 64-state scenario of the same workbook reproduces in about 17 minutes
Fixed field order · controlled verdict vocabulary (Advantage demonstrated / Parity / No advantage demonstrated / Inconclusive) · all records machine-readable at /evidence-runs.json
Portfolio Optimization RQP · published sample run
What an honest quantum benchmark looks like
78 assets, aggregated into 23 binary decisions (17 single names + 6 thematic bundles), 3 sector-budget bands, QAOA depth p=4 — every one of the 8.4 million possible portfolios evaluated exactly, against a certified classical referee.
8,388,608
Portfolios in the search space
0.0%
QAOA gap to certified optimum
+3.2%
Classical heuristic gap
137×
Odds boost for the optimal state
Read the full runShow less▸
Winning portfolio: 8.0% expected return · 15.3% volatility · Sharpe 0.33 · budget gap 0.08% Run: 2 h 28 min certified end-to-end · warm-started p=4 · statevector simulator · seed 42, reproducible
- ✓
Verified, not asserted. QAOA's best portfolio equals the referee's proven optimum — gap 0.0%, certified by exact branch & bound (MIQP/SCIP) — while the classical heuristic fell 3.2% short.
- ✓
No magic claimed. The optimum's sampling probability was 0.0016% — a 137× boost over uniform, and still a small number. Both figures are printed in the report.
- ✓
Scale is stated, not implied. Simulator memory doubles with every qubit — around 30 is where real hardware has to take over. Prototyping below that line, with a referee, is how you build a quantum case you can defend.
Run recordQL-EV-001Printed verdict: Parity16 Jul 2026▸
Product
Portfolio Optimization RQP (QAOA)
Problem
Long-only portfolio selection under 3 sector-budget bands
Instance
78 assets → 23 binary decisions (17 single names + 6 thematic bundles); 2²³ = 8,388,608 candidate portfolios
Data
78-asset demo universe — illustrative, not investment advice
Classical referee
Exact branch & bound (MIQP, SCIP) — certified optimum over the full space
Referee result
Expected return 8.0% · volatility 15.3% · Sharpe 0.33 · budget gap 0.08%
Classical baseline
Heuristic search, 465 candidates — +3.2% gap, optimum not reached
Quantum method
QAOA, depth p=4, warm-started, seed 42
Execution
Statevector simulator, 23 qubits, exact readout (no sampling) · 2 h 28 min certified end-to-end
Quantum result
Gap 0.0% — best QAOA portfolio equals the SCIP-proven optimum, bit for bit · P(optimum) 0.0016% = 137× uniform
Verdict basis
Solution quality matched the certified optimum at a scale where classical enumeration is exact; advantage not claimed
Limitations
Optimum sampling probability 0.0016% — a boost, still small · simulator memory doubles per qubit, ~30 is the hardware line · demo data
Reproducibility
Seed 42 · certified PDF report in the RQP Resource Room
Fixed field order · controlled verdict vocabulary (Advantage demonstrated / Parity / No advantage demonstrated / Inconclusive) · all records machine-readable at /evidence-runs.json
Robust Stochastic Collateral Allocation RQP · published sample run
The cheapest allocation and the stable one are different. The referee prices both.
Tuesday-morning margin calls at a Swiss bank treasury: three venues calling at once, 23 collateral lines — ten locked, three pledge pools that move whole — 50 stress scenarios, and a 24-variable register. A scenario-covariance term trades posting cost against coverage stability, and an exact referee enumerates every valid allocation to prove the optimum.
16,777,216
Allocations in the search space
0.00%
QAOA gap to certified optimum
2.6%
The optimum is the modal state
CHF 19k/yr
The certified price of coverage stability
Read the full runShow less▸
Winning allocation: govt-bond ladder to LCH · Pfandbrief pool to Eurex · equity basket to the CSA — equities where they are cheapest to give away, priced at a 14% scenario undercoverage probability the stress panel prints openly Run: 29 min end-to-end · warm-started CVaR QAOA p=3 · exact readout of all 16.8M states · fixed seeds, reproducible
- ✓
Seeded, and it says so. The register starts warm — rotated toward the best classically-enumerated allocation — and the report states it. The quantum sampler's job is to concentrate on or improve that incumbent; the exhaustive referee certifies whichever answer any method produces. On this run it concentrated so hard the optimum became the single most likely state.
- ✓
The first runs failed, and it's printed. Expected-energy training sampled an infeasible best allocation, and a too-coarse slack encoding once made the QUBO's own minimum provably infeasible — no optimizer could have sampled its way out. Both failures are published; the auto-calibration they forced now prints its choices in every report.
- ✓
Stress is classical, and labeled. The coverage-under-stress panel and the cost-vs-stability frontier are classical scenario analysis over the workbook's own scenarios, labeled as such in the report. The quantum content is the allocation decision; the tail machinery's quantum counterpart — amplitude estimation — lives in the QMC Lab, measured transparently.
- ✓
Above the cap, quantum steps aside. The full-scale flagship workbook (36 QUBO variables) is beyond the statevector simulator, so its quantum stage is skipped by design — the run completes classically with the certificate, frontier, and stress panels at full scale, and the report says exactly that.
Run recordQL-EV-003Printed verdict: Parity10 Aug 2026▸
Product
Robust Stochastic Collateral Allocation RQP (CVaR QAOA)
Problem
Collateral allocation across three venues under margin calls — posting cost vs coverage stability via a scenario-covariance term
Instance
23 collateral lines (10 locked, 3 pledge pools moving whole) · 50 stress scenarios · 24-variable register; 2²⁴ = 16,777,216 allocations
Data
Swiss bank treasury demo workbook — illustrative
Classical referee
Exhaustive enumeration of every valid allocation — proven optimum
Referee result
Certified optimum: govt-bond ladder to LCH · Pfandbrief pool to Eurex · equity basket to the CSA · 14% scenario undercoverage probability, printed
Classical baseline
Best classically-enumerated allocation used as warm-start incumbent (stated in report)
Quantum method
Warm-started CVaR QAOA, depth p=3, fixed seeds
Execution
Exact statevector readout of all 16.8M states · 29 min end-to-end
Quantum result
Gap 0.00% — the optimum became the modal state at 2.6% (~428,000× uniform) · frontier flip priced at CHF 19k/yr (flagship run)
Verdict basis
Concentrated on the enumeration-proven optimum from a stated warm start; advantage not claimed
Limitations
Stress panels are classical scenario analysis, labeled · 36-variable flagship exceeds the simulator — quantum stage skipped by design · early failures (infeasible best allocation, too-coarse slack encoding) published
Reproducibility
Fixed seeds · certified PDF report of 10 Aug 2026 in the RQP Resource Room
Fixed field order · controlled verdict vocabulary (Advantage demonstrated / Parity / No advantage demonstrated / Inconclusive) · all records machine-readable at /evidence-runs.json
Index Replication RQP · published sample run
Your mandate rules have a price. The quantum benchmark certifies it.
Enhanced-indexing the S&P 500 with 20 instruments: 500 assets in the objective, 17 selection qubits — and a referee that re-solves the mandate to price every rule in tracking error.
4.473%
Certified minimum tracking error
0.00%
QAOA gap to certified optimum
+3.39%
Greedy heuristic gap
Read the full runShow less▸
The constraints landscape — every rule priced by the referee
Certified cost = optimum re-solved with only that rule removed. Unedited from the report.
Technology band
4–6 names required · landed at 6
+0.332%
Climate-transition band
2–4 names required · landed at 4
+0.339%
Both rules together
the package overlaps — it costs no more than its strictest rule
+0.339%
The irreducible floor: the instrument pool and exclusions alone impose 3.098% tracking error before any mandate rule applies.
Run: 110 s end-to-end · QAOA 53.8 s (p=2, 3 restarts, exact readout) · referee proof 11.2 s · 17 qubits, 544 two-qubit gates
- ✓
Constraints stop being opinions. Each mandate rule is priced by re-solving the certified optimum with only that rule removed. The mandate discussion becomes numbers, not beliefs.
- ✓
The irreducible floor is stated. The instrument pool and exclusions alone impose 3.098% tracking error before any rule applies — whatever the pool cannot replicate shows up openly, not hidden in a heuristic.
- ✓
No magic claimed. Only 3.6% of raw quantum readout hit the 20-name cardinality; candidates were repaired, and the best one reached the optimum after a single disclosed polish swap. On today's hardware this 544-two-qubit-gate circuit would retain ~7% fidelity. It's all printed in the report.
Run recordQL-EV-002Printed verdict: Parity12 Jul 2026▸
Product
Index Replication RQP (QAOA)
Problem
Enhanced indexing of the S&P 500 with 20 instruments under mandate rules (technology band, climate-transition band)
Instance
500 assets in the objective, 17 selection qubits, 20-name cardinality; demo mandate, 20 ISINs
Data
S&P 500 demo mandate — illustrative, not investment advice
Classical referee
SCIP dual bound, MIP gap 0 — certified minimum tracking error; each rule priced by re-solving with that rule removed
Referee result
Certified minimum tracking error 4.473% · irreducible floor 3.098% from pool and exclusions alone
Classical baseline
Greedy heuristic (industry-standard shortcut) +3.39% · random baseline +1.20%
Quantum method
QAOA, depth p=2, 3 restarts, exact readout
Execution
17 qubits, 544 two-qubit gates · 110 s end-to-end (QAOA 53.8 s, referee proof 11.2 s)
Quantum result
Gap 0.00% — its basket is a certified-optimal one, after repair and a single disclosed polish swap
Verdict basis
Matched the certified optimum; 3.6% of raw readout met the cardinality — repair pipeline disclosed; advantage not claimed
Limitations
On today's hardware this circuit would retain ~7% fidelity · candidates repaired before scoring · demo data
Reproducibility
Certified PDF report in the RQP Resource Room
Fixed field order · controlled verdict vocabulary (Advantage demonstrated / Parity / No advantage demonstrated / Inconclusive) · all records machine-readable at /evidence-runs.json
QML Classification RQP · published sample runs
Don’t bet on quantum. Measure it.
Classifying German power-price spikes with an 8-qubit quantum kernel against six tuned classical baselines — 17,157 rows, an exact 10,294×10,294 quantum kernel, paired bootstrap statistics. For this dataset the measured answer was “not yet” — and that verdict is the product working as designed. The counterpart below — a quantum-native demo dataset — passed the same gate and finished with the whole confidence interval above 1.0.
34/100
QML suitability score — this dataset
0.92×
Advantage factor, raw features
0.99×
Advantage factor, Fourier-engineered features
1 day
The cost of knowing
Read the full runShow less▸
How these verdicts are produced
Two assessment levels gate every training run: Fast (seconds — classical probes and a suitability score) and Deep (minutes — kernel diagnostics and the five-condition checklist). Methodology after the Fourier Wall paper (arXiv:2607.15815); every check prints in the sample reports.
The same gate, passed — quantum-native demo dataset (26 Jul 2026)
1.45×
Advantage factor, quantum-native demo
0.89
VQC test F1 — vs 0.71 best classical
The deltas, audited — complementary-signal panel, BAF fraud benchmark (7 Aug 2026)
0.00
Quantum blend weight — fitted on validation
+0.0002
Ensemble delta vs classical-stack control
0.92×
Advantage factor, fraud-tuned run
- ✓
The bar is real. Quantum is scored against tuned classical baselines — including an order-matched periodic twin that reads, up to interaction order 3, exactly the structure an angle-encoded quantum model could pass off as “advantage” (methodology after the Fourier Wall paper, arXiv:2607.15815).
- ✓
Statistics, not vibes. An advantage is claimed only when the whole 95% confidence interval sits above 1.0. Better feature encoding moved the factor from 0.92 to 0.99 — a measured trajectory, not a promise. Today’s printed verdict: inconclusive within noise — and the five-condition quantum-territory checklist closes the case: still classical territory.
- ✓
Even the deltas get audited. The popular ensemble claim — “the quantum model sees what the classical models miss” — is now tested on every binary run: quantum-vs-classical disagreements are scored against a classical-ensemble control on identical rows. On the public BAF fraud benchmark, under a fraud-ops configuration, the fitted quantum blend weight came out 0.00 and the ensemble delta sat within noise — printed verdict: no complementary signal. Lift over a single classical model is ordinary ensemble diversity; the panel makes that distinction measurable.
- ✓
A verdict about one dataset — not about quantum. Other data profiles score differently; that is what the suitability filter is for. And “let's revisit later” only works if someone is measuring: the harness re-runs as encodings and hardware evolve, so the week the interval clears 1.0, you know.
Run recordQL-EV-004Printed verdict: No advantage demonstrated23 Jul 2026 · re-verified 26 Jul 2026▸
Product
QML Classification RQP (quantum kernel)
Problem
Classifying German power-price spikes
Instance
17,157 rows · exact 10,294×10,294 quantum kernel · 8-qubit feature map · QML suitability score 34/100 (±12): “too simple for quantum”
Data
German power-price spike demo dataset (public), baseline & Fourier-engineered features
Classical referee
Six tuned classical baselines incl. an order-matched periodic twin to interaction order 3 (Fourier Wall methodology, arXiv:2607.15815) · paired bootstrap
Referee result
Classical ahead on raw features; advantage claimed only if the whole 95% CI clears 1.0
Classical baseline
Included in the referee bar (six tuned models + classical-stack ensemble control)
Quantum method
Quantum kernel classifier, 8 qubits, exact kernel evaluation
Execution
Two-level assessment gate: Fast (seconds) and Deep (minutes) before any training run
Quantum result
Advantage factor 0.92× raw (95% CI 0.896–0.937, below 1.0) · 0.99× Fourier-engineered (95% CI 0.975–1.011, includes 1.0)
Verdict basis
Printed verdict: keep the classical model for this dataset, today — inconclusive within noise after encoding gains; five-condition checklist: still classical territory
Limitations
A verdict about one dataset, not about quantum · re-tested as encodings and hardware evolve
Reproducibility
Certified PDF reports in the RQP Resource Room · upgraded classical bar re-verification 26 Jul 2026
Fixed field order · controlled verdict vocabulary (Advantage demonstrated / Parity / No advantage demonstrated / Inconclusive) · all records machine-readable at /evidence-runs.json
Run recordQL-EV-005Printed verdict: Advantage demonstrated26 Jul 2026▸
Product
QML Classification RQP (quantum kernel + VQC)
Problem
Binary classification on a quantum-native demo dataset (quantum-teacher generated)
Instance
Same assessment gate and classical bar as QL-EV-004, passed
Data
Quantum-native demo dataset — full report and dataset in the Resource Room
Classical referee
Full classical bar incl. order-matched twin (Fourier Wall methodology) · paired bootstrap 95% CI
Referee result
Best classical F1 0.71
Classical baseline
Included in the referee bar
Quantum method
Quantum kernel + 6-qubit variational quantum classifier
Execution
Same two-level gate as QL-EV-004
Quantum result
Advantage factor 1.45× (95% CI 1.31–1.62, entirely above 1.0) · VQC test F1 0.89 vs 0.71 best classical
Verdict basis
Whole 95% CI above 1.0 against the full classical bar, order-matched twin included
Limitations
Quantum-native demo data — engineered to sit in quantum territory; scope is the gate working in both directions, not a market dataset win
Reproducibility
Full report and dataset in the RQP Resource Room
Fixed field order · controlled verdict vocabulary (Advantage demonstrated / Parity / No advantage demonstrated / Inconclusive) · all records machine-readable at /evidence-runs.json
Sources & scope
Portfolio run: published sample report of 16 Jul 2026 (78-asset demo universe). Index run: published sample report of 12 Jul 2026 (S&P 500 demo mandate, 20 ISINs). QML runs: published sample reports of 23 Jul 2026, re-verified 26 Jul 2026 under the upgraded classical bar (German power-price spike demo dataset, baseline & Fourier-engineered). Concentration study: 15–16 Aug 2026, 12,397 exact-statevector runs over 20 synthetic and 4 real demo instances (full study PDF linked above; raw results and design on request). QML assessment methodology: independent implementation inspired by Javier Mancilla and Tomas Tagliani, “The Fourier Wall: Why Public Tabular Datasets Refuse Quantum Advantage, and a Certified Recipe for Where It Lives” (arXiv:2607.15815); qubit-lab.ch is not affiliated with the authors. All reports are gated downloads in the RQP Resource Room. All figures are unedited solver output on demo data — illustrative only, not investment advice, not indicative of results on other problems.
Let’s explore — no strings attached
A relaxed 30-minute call or a live demo.
Management-friendly or physicist to physicist — your data, your questions, real runs. No slides, no obligations. Not sure which format fits your question? Start here →